

Metals & energy analysis Daily Analysis
Risk disclosure :
Trading forex and crypto is high risk and you may lose some or all of your capital. Brokercaster analyses are views, not buy or sell recommendations; only trade money you can afford to lose.
Gold closed at 3626 on 19 November, below the 3627 to 3660 support zone; that zone had been an important floor since September 2025 and, now broken, will probably act as resistance. The main daily trend has been down since 12 November. We read the decline from the 5597 record high (29 January 2026) as a two-part correction: the first part to 4098 (23 March), a rebound to 4889 (17 April), and a second part that is still unfolding. Within the second part, after the rebound to 4697 (25 August), the drop to 3869 (2 November) and the bounce to 4149 (9 November), price is probably in the third wave of the decline. We expect price to retest the broken 3627 to 3660 zone from below before the decline resumes; if that retest does not come, the scenario stays without an entry. Target 1 sits above the next support zone (3374 to 3416), where the two parts of the correction would also be equal.
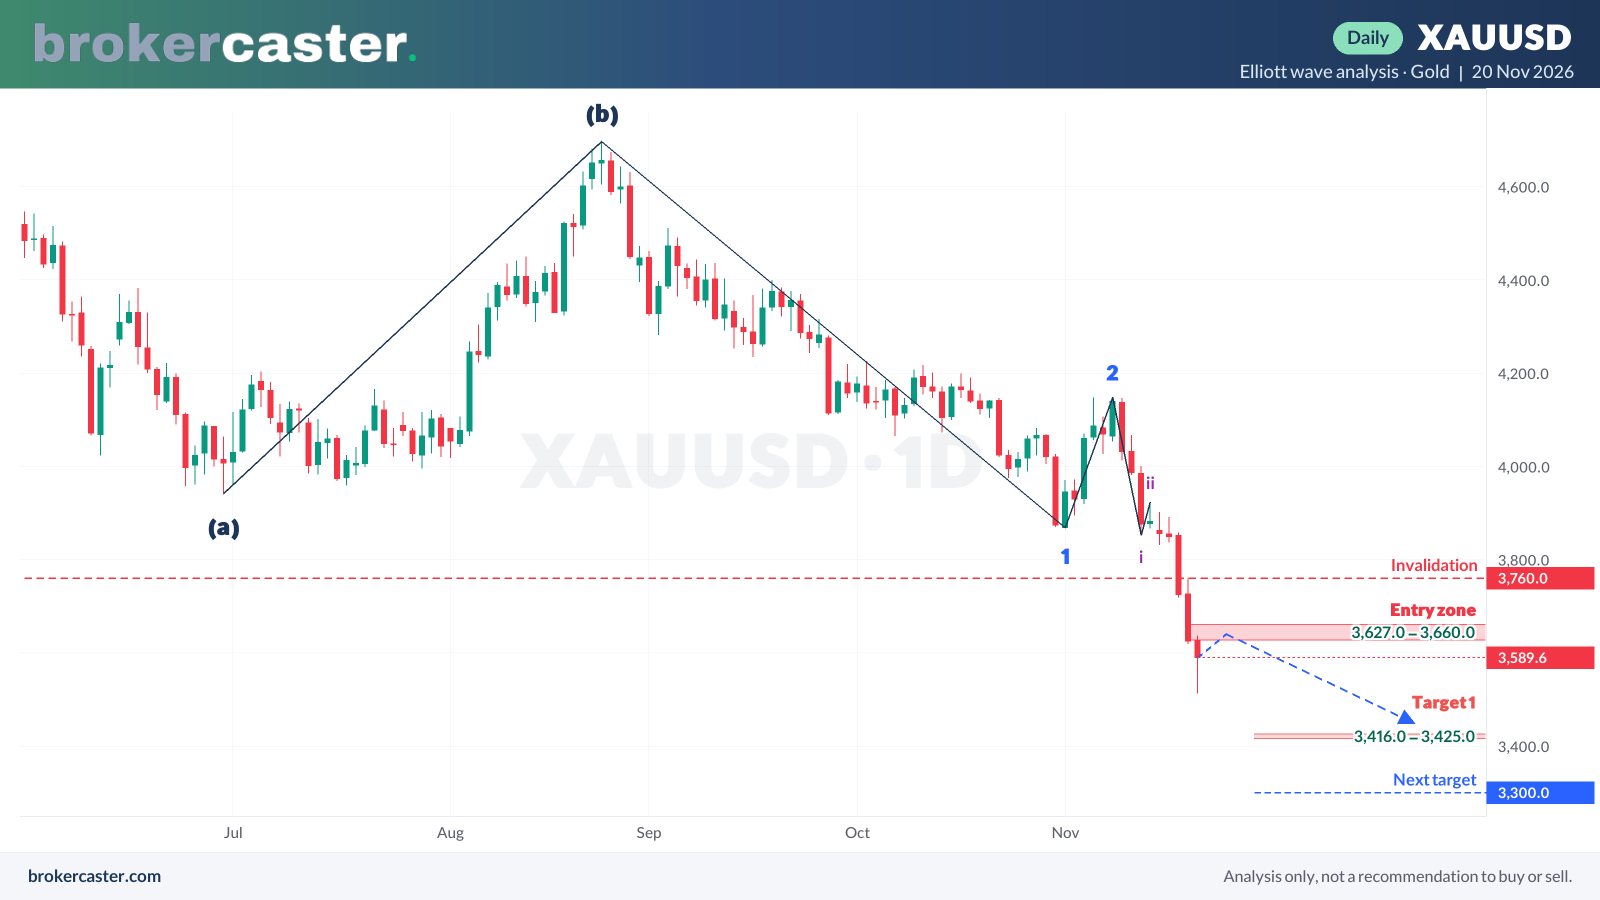
- Entry zone: 3627 to 3660 (the broken support zone)
- Target 1: 3425 to 3416 (above the August 2025 support zone)
- Next target: 3300 to 3290 (above the July 2025 support zone)
- Invalidation: a daily close above 3760 (the 19 November high, where the breakdown leg started); above 3923 the count is void
Alternative scenario: a daily close above 3760 would mean the break of 3627 was probably false, and price may range between 3627 and 3923; we would publish no new analysis until the direction is clear.
USD/CAD closed at 1.4324 on 18 November, above the 1.4300 high of 14 October, and the main daily trend turned up. We read the rise from the 1.3477 low (30 January 2026) as an uptrend that started a new leg after the correction to 1.3926 (4 November); within that leg, the rise from 1.4073 (9 November) is probably wave iii. We expect a short pullback (wave iv) into 1.4260 to 1.4220 before the advance resumes; if that pullback does not come, the scenario stays without an entry. Target 1 sits just below the December 2024 and January 2025 highs, which acted as resistance before.
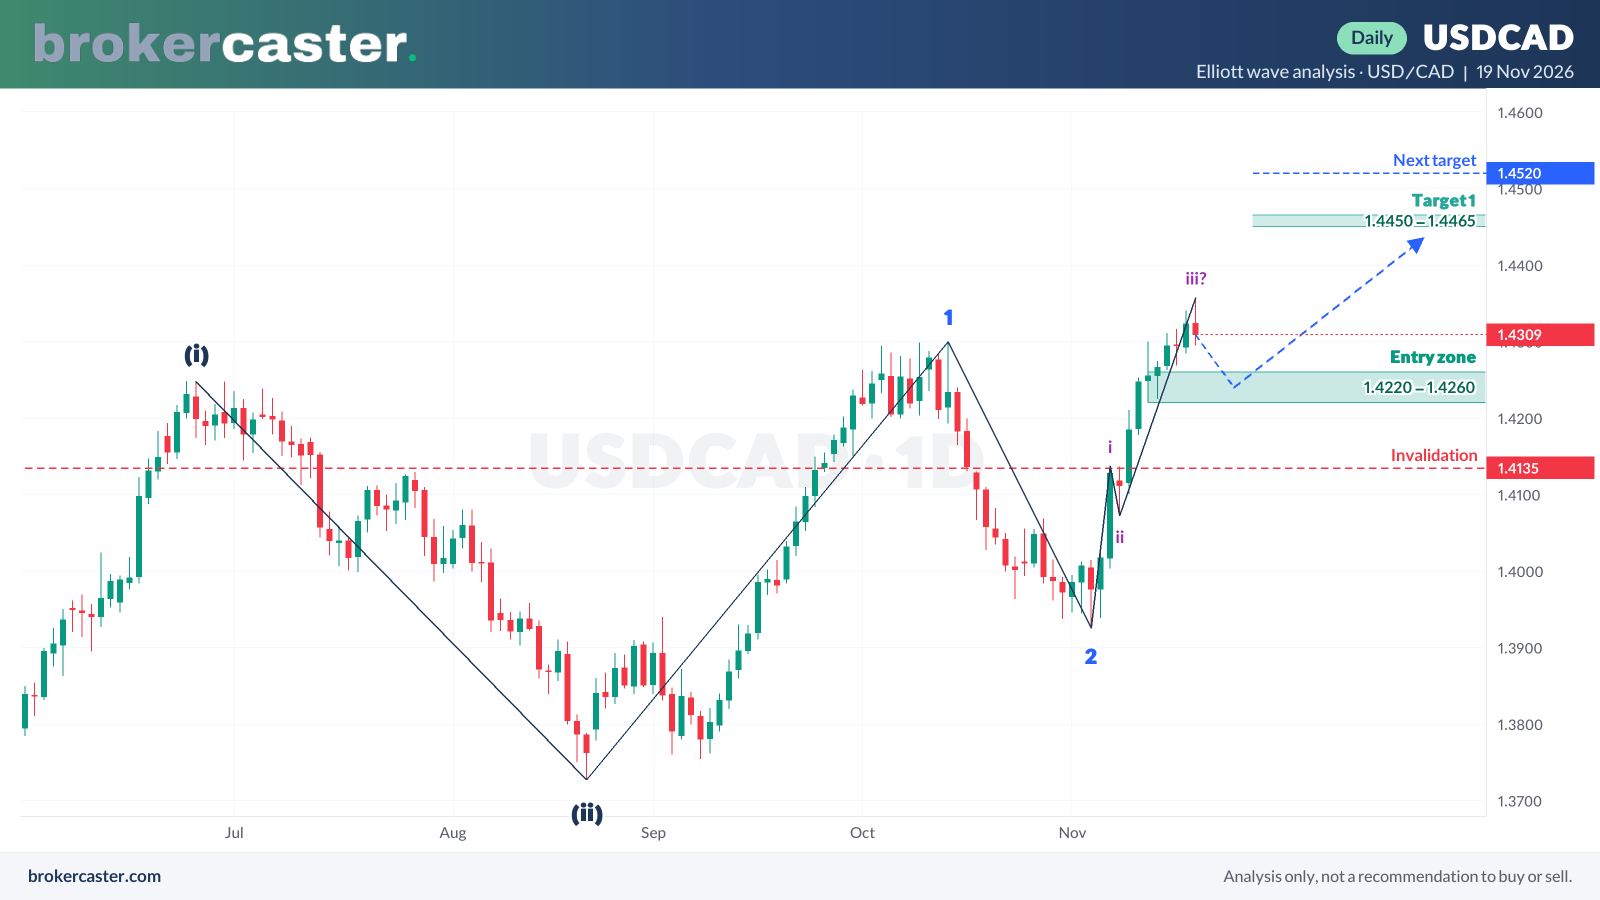
- Entry zone: 1.4260 to 1.4220 (the 12–13 November lows)
- Target 1: 1.4450 to 1.4465 (just below the 19 December 2024 and 3 January 2025 highs)
- Next target: 1.4520 to 1.4545 (the 4 and 11 March 2025 highs)
- Invalidation: a daily close below 1.4135 (the 6 November high); below 1.3926 the count is void
Alternative scenario: a daily close below 1.4135 would mean the rise from 1.3926 was probably corrective, and a deeper pullback toward 1.4073 to 1.4000 becomes likely; a further advance would then be reassessed after that pullback ends.
EUR/GBP fell to 0.8319 on 18 November. The larger structure is unchanged: the decline from the 0.8865 top (14 November 2025) is a three-part correction, and its final leg began at 0.8730 (18 May 2026); wave 1 ended at 0.8454 (15 July), wave 2 at 0.8612 (25 September), and wave 3 still appears to be under way. The main daily trend is down, and while price holds below the lower highs of the past three weeks, a further decline toward 0.8280 to 0.8262 is likely. We expect a short rebound to the top of the three-week range (0.8355 to 0.8373) before the next leg; if that rebound does not come, the scenario stays without an entry. Price has moved slowly in the past three weeks, so the target may take time.
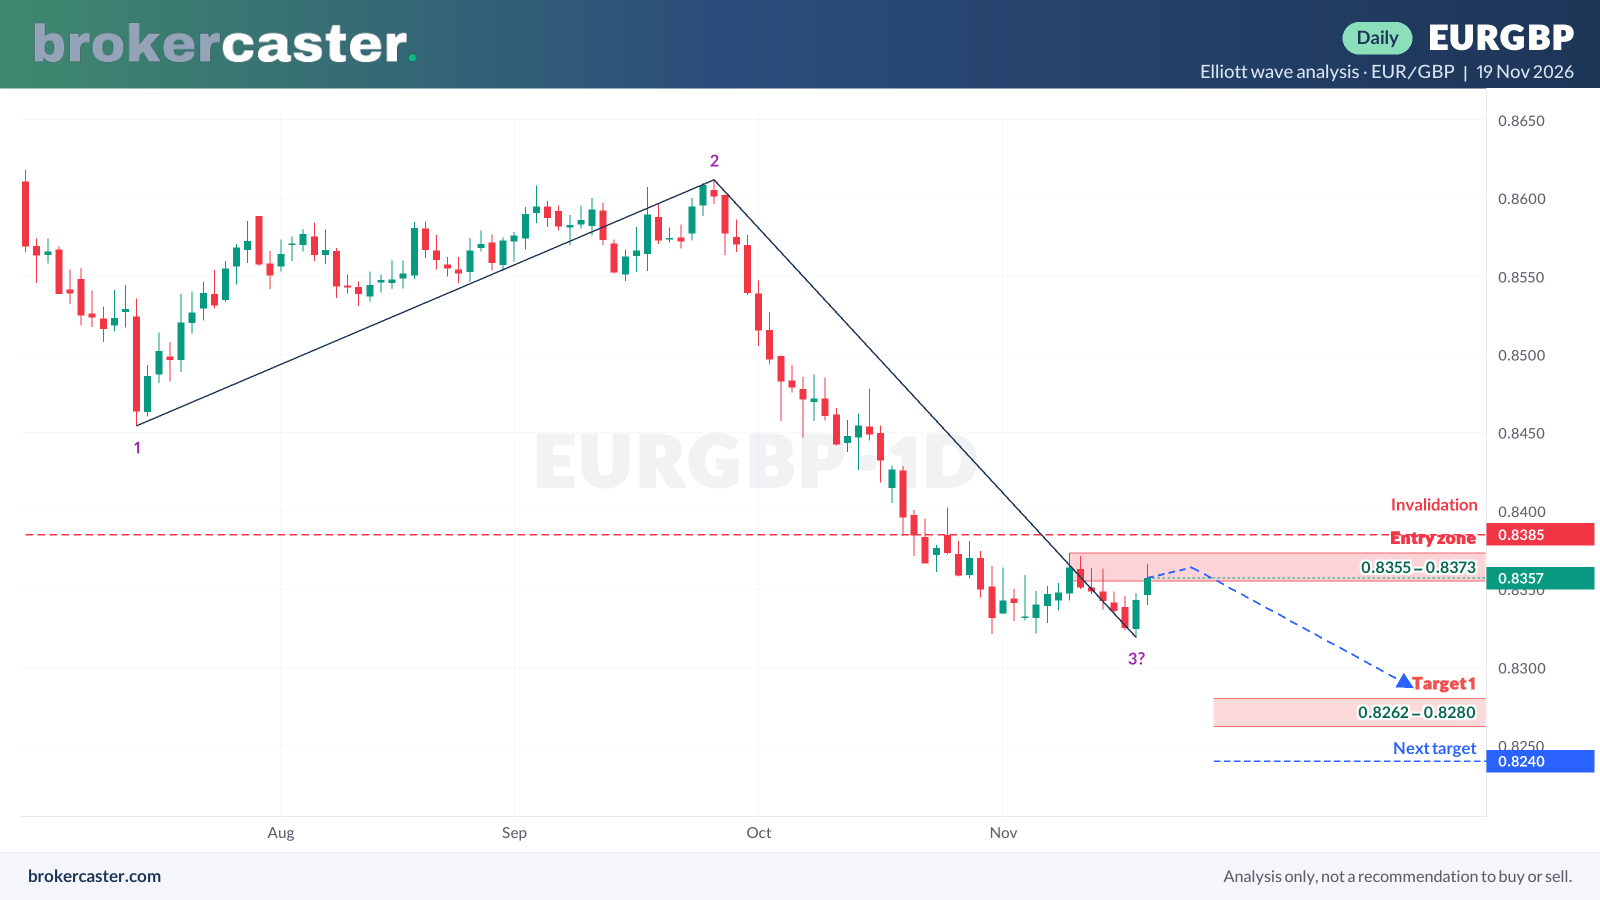
- Entry zone: 0.8355 to 0.8373 (top of the 10–13 November range)
- Target 1: 0.8280 to 0.8262 (just above the February 2025 support zone)
- Next target: 0.8240 to 0.8222 (the 19 December 2024 low)
- Invalidation: a daily close above 0.8385; above 0.8612 the count is void
Alternative scenario: a daily close above 0.8385 would suggest that wave 3 has ended and a corrective rebound (wave 4) toward 0.8415 to 0.8430 is under way; a further decline would then be reassessed only after that rebound ends.
The correction from the 2,805 top of 21 September has run deeper than expected, with a daily close below 1,870 on 14 November. We still read it as a double zigzag whose wave Y can extend into the 1,609 to 1,551 zone, where twice the length of wave W lines up with the June–July 2026 support area. The daily trend is down and no low is confirmed yet, so the rebound scenario is valid only inside this zone and remains conditional.
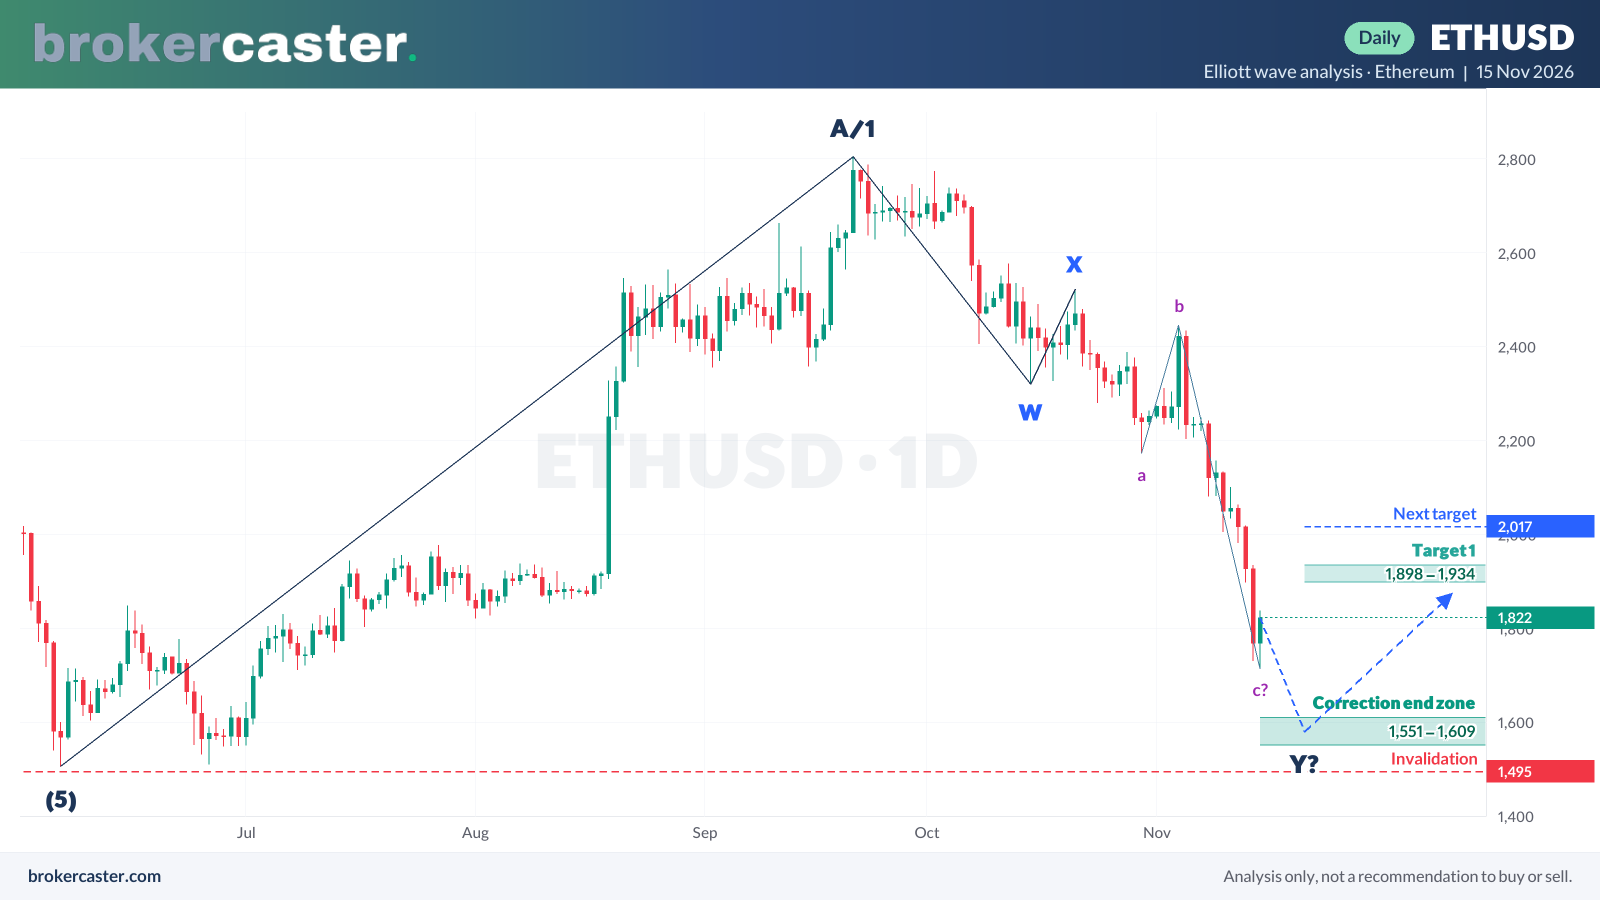
- Target 1: 1,898 to 1,934 (the 13–14 November area)
- Next target: 2,017 to 2,101, then 2,173 (the 30 October low)
- Entry zone: 1,609 to 1,551 (possible end of wave Y)
- Invalidation: a daily close below 1,495 (below the June and July 2026 lows)
Alternative scenario: a daily close below 1,495 would mean the 1,507 to 2,805 rally was itself corrective and the larger decline from the 4,954 top is still unfolding; the April 2025 area near 1,387 and lower would then come into view.