

Crypto Analysis: Bitcoin, Ethereum, XRP & More
Risk disclosure :
Trading forex and crypto is high risk and you may lose some or all of your capital. Brokercaster analyses are views, not buy or sell recommendations; only trade money you can afford to lose.
The correction from the 2,805 top of 21 September has run deeper than expected, with a daily close below 1,870 on 14 November. We still read it as a double zigzag whose wave Y can extend into the 1,609 to 1,551 zone, where twice the length of wave W lines up with the June–July 2026 support area. The daily trend is down and no low is confirmed yet, so the rebound scenario is valid only inside this zone and remains conditional.
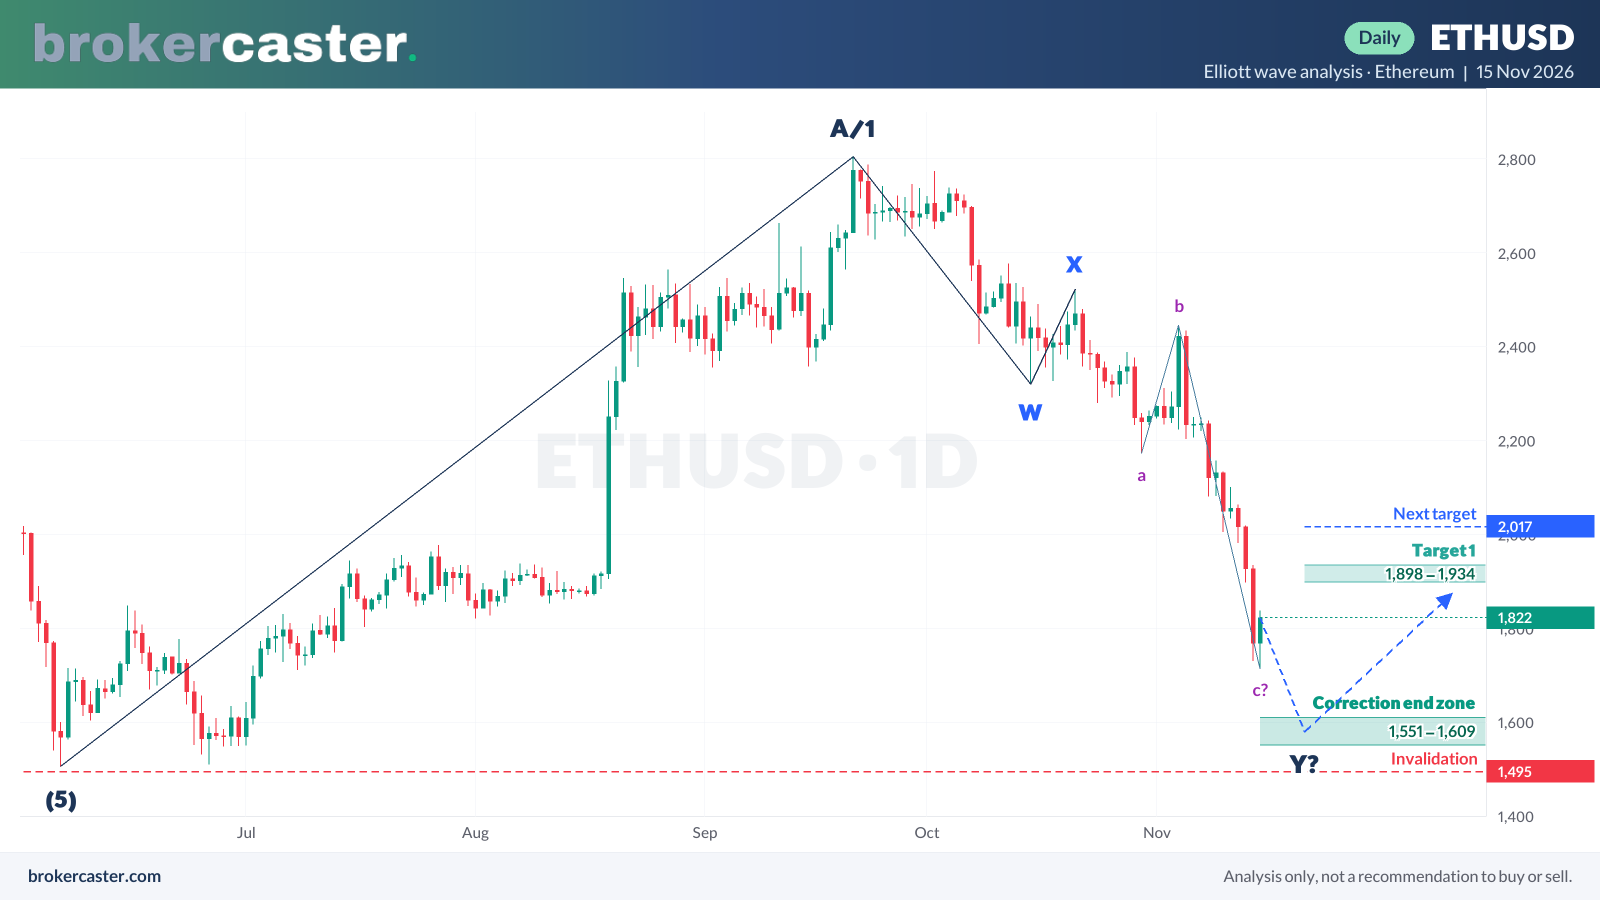
- Target 1: 1,898 to 1,934 (the 13–14 November area)
- Next target: 2,017 to 2,101, then 2,173 (the 30 October low)
- Entry zone: 1,609 to 1,551 (possible end of wave Y)
- Invalidation: a daily close below 1,495 (below the June and July 2026 lows)
Alternative scenario: a daily close below 1,495 would mean the 1,507 to 2,805 rally was itself corrective and the larger decline from the 4,954 top is still unfolding; the April 2025 area near 1,387 and lower would then come into view.
Cryptocurrencies we analyse
| Bitcoin (BTC) | $60,721 +1.49% · Bitcoin (BTC) analysis · the largest cryptocurrency; it sets the tone for the whole market |
|---|---|
| Ethereum (ETH) | $1,715.22 +1.99% · Ethereum (ETH) analysis · the main smart-contract network; often swings more than Bitcoin |
| XRP | XRP analysis · a payments-focused token, sensitive to legal and regulatory news |
| Litecoin (LTC) | Litecoin (LTC) analysis · one of the oldest altcoins; follows Bitcoin closely |
| Polkadot (DOT) | Polkadot (DOT) analysis · a multi-chain network and a higher-risk altcoin |
Prices and 24-hour changes from our hourly data where available; each coin has its own page with a live chart.
Crypto analysis: Bitcoin, Ethereum and major altcoins
This page collects our technical analysis of Bitcoin, Ethereum, XRP, Litecoin and Polkadot. Each coin has its own page with a live chart and a short guide, and new analyses appear both here and on the coin’s page.
What moves the crypto market
- Bitcoin first. Most altcoins follow Bitcoin’s direction, usually with bigger swings both ways.
- Liquidity and interest rates. Like other risky assets, crypto tends to rise when money is cheap and fall when central banks tighten.
- Fund flows. Since US spot Bitcoin ETFs launched in January 2024 (and Ethereum ETFs in July 2024), their daily inflows and outflows are watched closely.
- Regulation and security news. Court rulings, exchange failures and hacks can move prices sharply within hours.
- Supply. The number of new bitcoins created halves about every four years; the last halving was in April 2024.
Crypto technical analysis: how to read our scenarios
Crypto trades 24 hours a day, seven days a week, and moves of several percent in a day are common, far more than on major currency pairs. Each analysis is a scenario with the zone where it becomes active, targets and an invalidation level, labelled with the result afterwards. Because of the volatility, many traders risk a smaller share of their account on a crypto trade than on a forex trade.
Trading crypto with a broker or an exchange
On a crypto exchange you buy the coins and own them; at a broker you usually trade price moves as CFDs without owning the coin. Crypto CFDs are not offered to retail clients in the UK, and leverage on them is capped at 1:2 in the EU and Australia; offshore brokers allow far more, which multiplies losses too. See which brokers offer crypto in our broker reviews.