

USD/CAD Today: Live Chart, Analysis & Forecast
USD/CAD rate: 1.4339 +0.01% vs 24 hours ago Last price before market close, 20 November, 22:00 UTC
USD/CAD, nicknamed the «loonie», shows how many Canadian dollars one US dollar buys; oil prices and the Bank of Canada matter most for it.
Risk disclosure :
Trading forex and crypto is high risk and you may lose some or all of your capital. Brokercaster analyses are views, not buy or sell recommendations; only trade money you can afford to lose.
USD/CAD closed at 1.4324 on 18 November, above the 1.4300 high of 14 October, and the main daily trend turned up. We read the rise from the 1.3477 low (30 January 2026) as an uptrend that started a new leg after the correction to 1.3926 (4 November); within that leg, the rise from 1.4073 (9 November) is probably wave iii. We expect a short pullback (wave iv) into 1.4260 to 1.4220 before the advance resumes; if that pullback does not come, the scenario stays without an entry. Target 1 sits just below the December 2024 and January 2025 highs, which acted as resistance before.
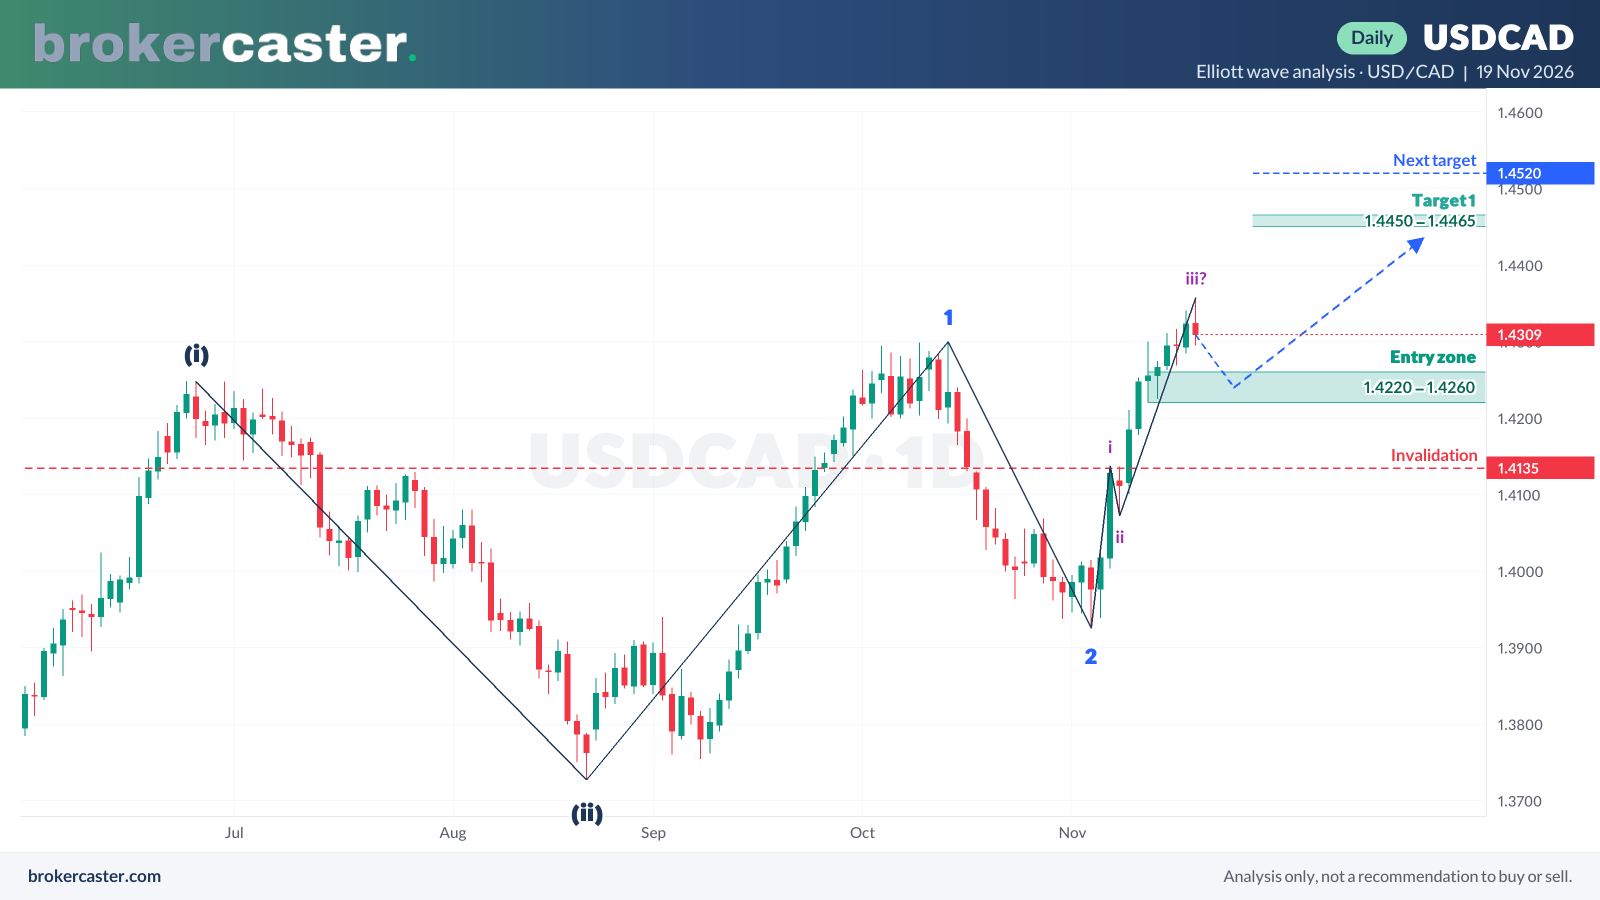
- Entry zone: 1.4260 to 1.4220 (the 12–13 November lows)
- Target 1: 1.4450 to 1.4465 (just below the 19 December 2024 and 3 January 2025 highs)
- Next target: 1.4520 to 1.4545 (the 4 and 11 March 2025 highs)
- Invalidation: a daily close below 1.4135 (the 6 November high); below 1.3926 the count is void
Alternative scenario: a daily close below 1.4135 would mean the rise from 1.3926 was probably corrective, and a deeper pullback toward 1.4073 to 1.4000 becomes likely; a further advance would then be reassessed after that pullback ends.
USD/CAD today at a glance
| USD/CAD rate (Canadian dollars per US dollar) | 1.4339 (20 Nov, 22:00 UTC) |
|---|---|
| Change vs 24 hours ago | +0.01% |
| Change over 1 week / 1 month | +0.50% / +2.09% |
| Change over 1 year | +1.72% |
| 52-week high | 1.4357 (19 Nov 2026) |
| 52-week low | 1.3477 (29 Jan 2026) |
| Nickname | Loonie |
| One pip | 0.0001 |
| Central banks | Bank of Canada (BoC) and US Federal Reserve (Fed) |
| Busiest hours | New York session, especially at 13:30 UTC data releases |
Figures from our hourly price data; the live chart above updates in real time.
What is USD/CAD?
USD/CAD is the exchange rate between the US dollar and the Canadian dollar: how many Canadian dollars one US dollar buys. Traders call the Canadian dollar the “loonie” after the loon bird on Canada’s one-dollar coin.
What moves USD/CAD?
- Oil prices. Canada is one of the world’s largest oil exporters, so a rise in crude usually strengthens the Canadian dollar and pushes USD/CAD down.
- Bank of Canada vs the Fed. The difference in expected interest rates; see our central bank rates.
- Jobs data. Canada often releases its monthly jobs report at the same time as US non-farm payrolls, which makes that hour very volatile.
- Trade with the US. Most Canadian exports go to the US, so trade policy and tariffs matter.
Release times are in our economic calendar.
USD/CAD forecast: how to read our analysis
Brokercaster publishes USD/CAD analyses as scenarios on the daily chart: where the idea becomes active, one or two targets and the invalidation level that cancels it. Each one is labelled hit or failed afterwards, so the record stays visible. They are views, not buy or sell signals.
Trading USD/CAD with a broker
USD/CAD is traded as spot forex or a CFD; costs are the spread, any commission and the overnight swap. Retail leverage is capped at 1:30 in the EU, UK and Australia, and losses can exceed what you expect at high leverage. Compare costs and regulation in our broker reviews and see which brokers accept your country in brokers by country.