

Gold Price Today (XAUUSD): Live Chart & Forecast
Gold price (ounce): 3,538.18 $ -2.41% vs 24 hours ago Last price before market close, 20 November, 21:00 UTC
Spot gold is the US-dollar price of one troy ounce (31.1 grams) of pure gold and the benchmark for gold prices in every market.
Risk disclosure :
Trading forex and crypto is high risk and you may lose some or all of your capital. Brokercaster analyses are views, not buy or sell recommendations; only trade money you can afford to lose.
Gold closed at 3626 on 19 November, below the 3627 to 3660 support zone; that zone had been an important floor since September 2025 and, now broken, will probably act as resistance. The main daily trend has been down since 12 November. We read the decline from the 5597 record high (29 January 2026) as a two-part correction: the first part to 4098 (23 March), a rebound to 4889 (17 April), and a second part that is still unfolding. Within the second part, after the rebound to 4697 (25 August), the drop to 3869 (2 November) and the bounce to 4149 (9 November), price is probably in the third wave of the decline. We expect price to retest the broken 3627 to 3660 zone from below before the decline resumes; if that retest does not come, the scenario stays without an entry. Target 1 sits above the next support zone (3374 to 3416), where the two parts of the correction would also be equal.
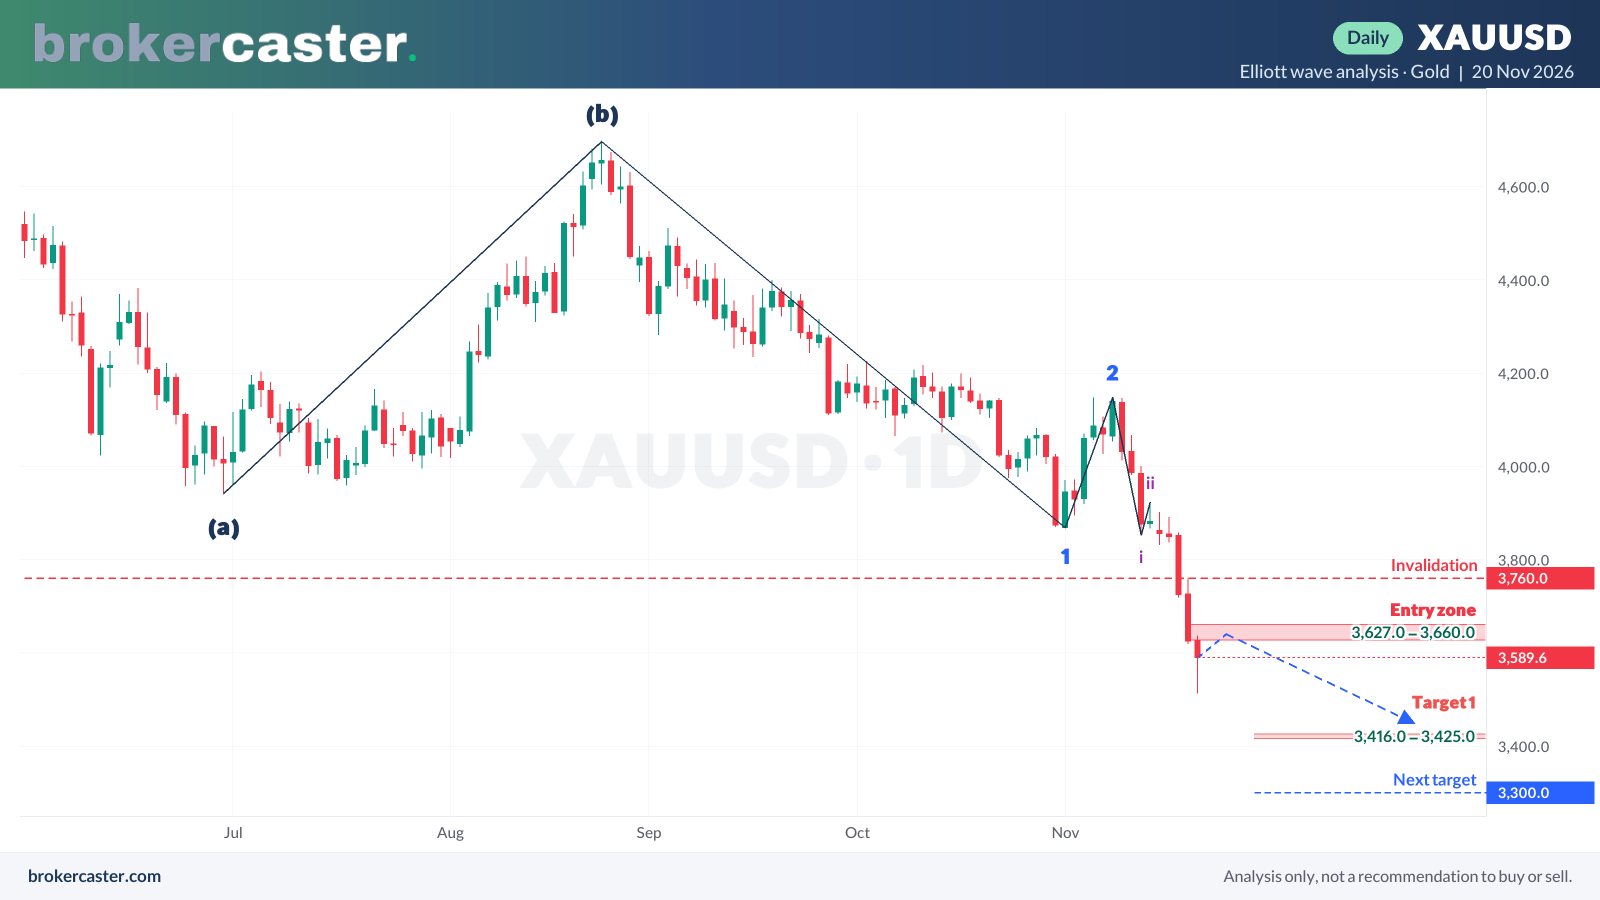
- Entry zone: 3627 to 3660 (the broken support zone)
- Target 1: 3425 to 3416 (above the August 2025 support zone)
- Next target: 3300 to 3290 (above the July 2025 support zone)
- Invalidation: a daily close above 3760 (the 19 November high, where the breakdown leg started); above 3923 the count is void
Alternative scenario: a daily close above 3760 would mean the break of 3627 was probably false, and price may range between 3627 and 3923; we would publish no new analysis until the direction is clear.
Gold today at a glance
| Spot gold price (USD per troy ounce) | $3,514.69 (20 Nov, 21:59 UTC) |
|---|---|
| Change vs 24 hours ago | −3.06% |
| Change over 1 week / 1 month | −9.49% / −15.12% |
| Change over 1 year | −13.78% |
| 52-week high | $5,596.81 (28 Jan 2026) |
| 52-week low | $3,502.69 (20 Nov 2026) |
| Symbol at brokers | XAUUSD (spot gold against the US dollar) |
| Unit | One troy ounce = 31.1035 grams of fine gold |
| Trading hours | Nearly 24 hours a day, Monday to Friday; busiest when London and New York overlap |
| Main drivers | US real interest rates, the US dollar, central-bank buying, safe-haven demand |
Figures from our hourly price data; the live chart above updates in real time.
What is the gold price (XAUUSD)?
The gold price you see on this page is the spot price of one troy ounce of fine gold in US dollars. Brokers and charting platforms list it as XAUUSD: XAU is the code for gold and USD for the US dollar. Spot gold trades over the counter almost around the clock on weekdays, and the twice-daily LBMA Gold Price auctions in London (10:30 and 15:00 London time) serve as an official reference for contracts worldwide. Gold futures on COMEX in New York follow the same price closely.
What moves the gold price?
- US real interest rates. Gold pays no interest, so when inflation-adjusted bond yields rise, holding gold costs more in missed income and the price usually comes under pressure; falling real yields tend to support it.
- The US dollar. Gold is priced in dollars, so a weaker dollar makes it cheaper for buyers using other currencies and often lifts XAUUSD.
- Central-bank buying. Central banks bought more than 1,000 tonnes a year in 2022, 2023 and 2024 (World Gold Council data), a steady source of demand.
- Safe-haven demand. Wars, financial stress and political uncertainty push investors toward gold.
- Fed decisions and US data. Inflation (CPI), jobs (non-farm payrolls) and Federal Reserve meetings often cause the largest daily moves; check the economic calendar and central bank rates before trading.
Gold price forecast: how to read our analysis
Brokercaster publishes gold analyses as clear scenarios on the daily chart: the zone or level where the idea becomes active, one or two price targets, and the invalidation level that cancels it. After the event we label each analysis as hit or failed, so the record stays visible. No one can predict tomorrow’s gold price with certainty; an analysis is a structured view, not a buy or sell signal.
How to trade gold with a broker
Retail traders usually trade gold as a CFD on XAUUSD, with costs coming from the spread, any commission and overnight financing (swap). Leverage magnifies losses as well as gains: in the EU, UK and Australia retail leverage on gold is capped at 1:20. Compare spreads, regulation and withdrawal terms in our broker reviews and check which brokers accept clients from your country in brokers by country.