

Gold, Silver, Oil & Gas Analysis: Live Charts
Risk disclosure :
Trading forex and crypto is high risk and you may lose some or all of your capital. Brokercaster analyses are views, not buy or sell recommendations; only trade money you can afford to lose.
Gold closed at 3626 on 19 November, below the 3627 to 3660 support zone; that zone had been an important floor since September 2025 and, now broken, will probably act as resistance. The main daily trend has been down since 12 November. We read the decline from the 5597 record high (29 January 2026) as a two-part correction: the first part to 4098 (23 March), a rebound to 4889 (17 April), and a second part that is still unfolding. Within the second part, after the rebound to 4697 (25 August), the drop to 3869 (2 November) and the bounce to 4149 (9 November), price is probably in the third wave of the decline. We expect price to retest the broken 3627 to 3660 zone from below before the decline resumes; if that retest does not come, the scenario stays without an entry. Target 1 sits above the next support zone (3374 to 3416), where the two parts of the correction would also be equal.
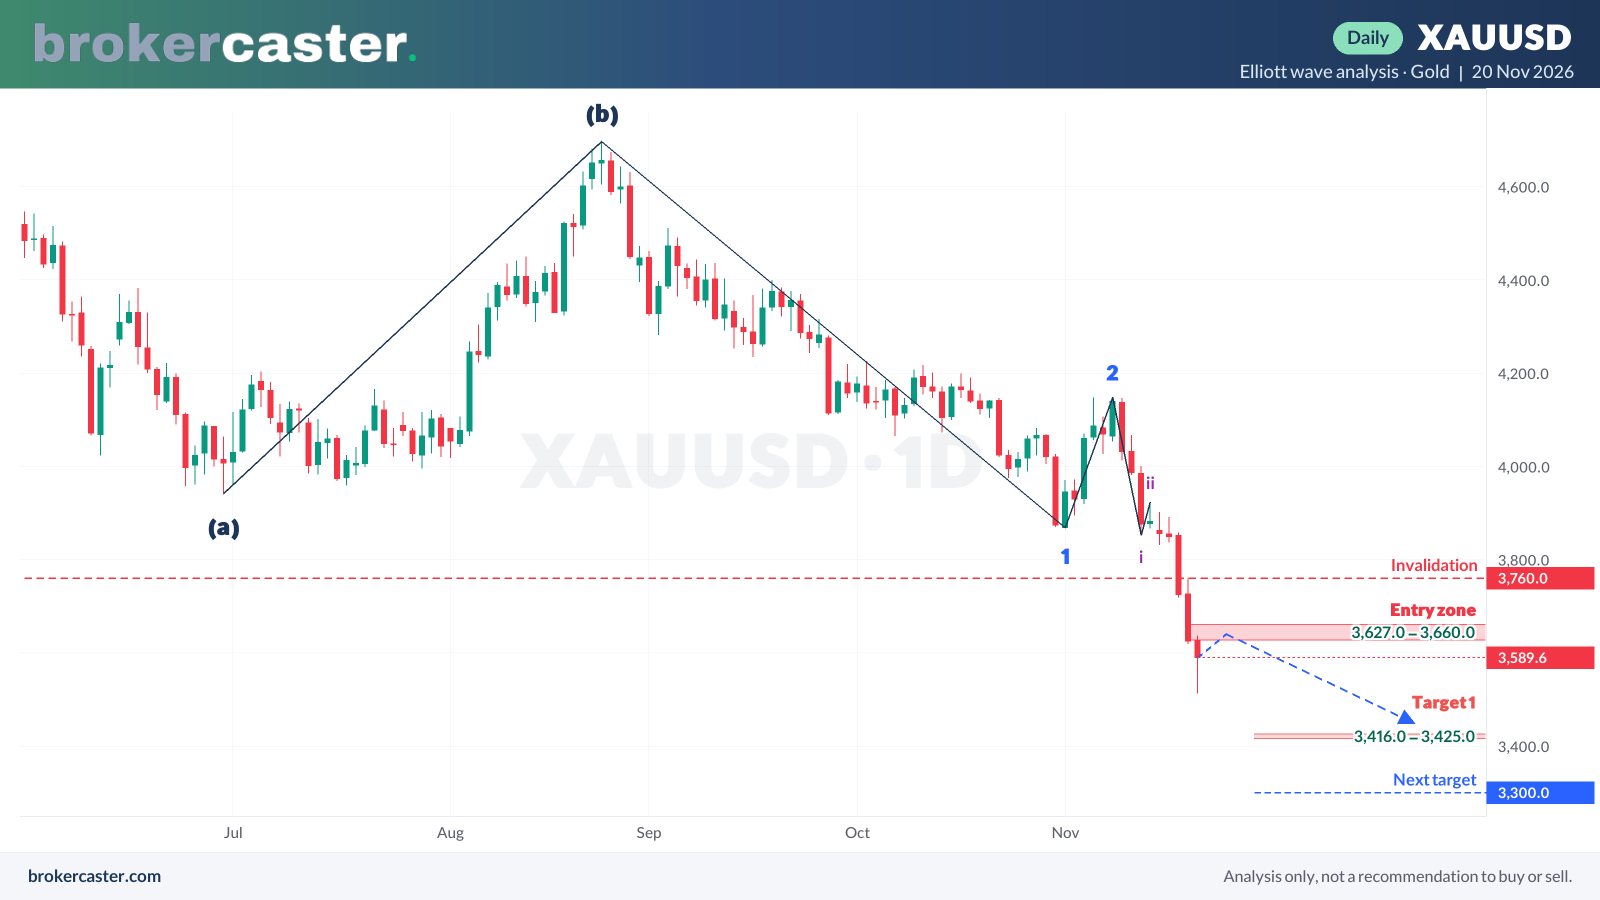
- Entry zone: 3627 to 3660 (the broken support zone)
- Target 1: 3425 to 3416 (above the August 2025 support zone)
- Next target: 3300 to 3290 (above the July 2025 support zone)
- Invalidation: a daily close above 3760 (the 19 November high, where the breakdown leg started); above 3923 the count is void
Alternative scenario: a daily close above 3760 would mean the break of 3627 was probably false, and price may range between 3627 and 3923; we would publish no new analysis until the direction is clear.
Metals and energy markets we analyse
| Gold (XAUUSD) | $3,514.69 −3.06% · Gold (XAUUSD) analysis · safe haven; moves against US real interest rates and the dollar |
|---|---|
| Silver (XAGUSD) | $41.20 −3.87% · Silver (XAGUSD) analysis · part precious, part industrial metal; swings more than gold |
| Brent oil | $92.50 −0.15% · Brent oil analysis · the global oil benchmark: OPEC+ supply, demand and inventories |
| Natural gas | Natural gas analysis · weather, storage levels and LNG exports |
Prices and 24-hour changes from our hourly data; each market has its own page with a live chart.
Gold, silver, oil and gas analysis
This page brings together our analysis of four commodity markets: gold, silver, Brent crude oil and natural gas. Each has its own page with a live chart, key facts and a guide to its price drivers, and new analyses appear both here and on the market’s page.
What moves metals
- Real interest rates and the dollar. Gold and silver pay no interest and are priced in dollars, so rising inflation-adjusted yields or a stronger dollar usually weigh on them.
- Safe-haven demand. Wars, financial stress and political shocks push investors toward gold.
- Industrial demand. More than half of silver demand comes from industry, solar panels and electronics included (Silver Institute data), so silver also follows the economic cycle.
What moves oil and gas
- Supply decisions. OPEC+ production quotas and output from the US and other producers.
- Inventories. US crude stocks (usually Wednesdays) and natural gas storage (usually Thursdays) often move prices on the day.
- Demand and the season. Global growth, China’s imports, heating demand in winter and driving in summer.
- Geopolitics. Conflicts in producing regions and along shipping routes can add a risk premium within hours.
Trading commodities with a broker
Retail traders usually trade these markets as CFDs: gold as XAUUSD per troy ounce, silver as XAGUSD, oil per barrel (Brent or WTI) and natural gas per MMBtu. In the UK, the EU and Australia retail leverage is capped at 1:20 on gold and 1:10 on other commodities. Holding overnight adds swap costs, and oil and gas CFDs may roll from one futures contract to the next. Check the required margin with the margin calculator and compare costs in our broker reviews; upcoming inventory reports are in the economic calendar.