

Forex Analysis: EUR/USD, GBP/USD, USD/JPY & More
Risk disclosure :
Trading forex and crypto is high risk and you may lose some or all of your capital. Brokercaster analyses are views, not buy or sell recommendations; only trade money you can afford to lose.
USD/CAD closed at 1.4324 on 18 November, above the 1.4300 high of 14 October, and the main daily trend turned up. We read the rise from the 1.3477 low (30 January 2026) as an uptrend that started a new leg after the correction to 1.3926 (4 November); within that leg, the rise from 1.4073 (9 November) is probably wave iii. We expect a short pullback (wave iv) into 1.4260 to 1.4220 before the advance resumes; if that pullback does not come, the scenario stays without an entry. Target 1 sits just below the December 2024 and January 2025 highs, which acted as resistance before.
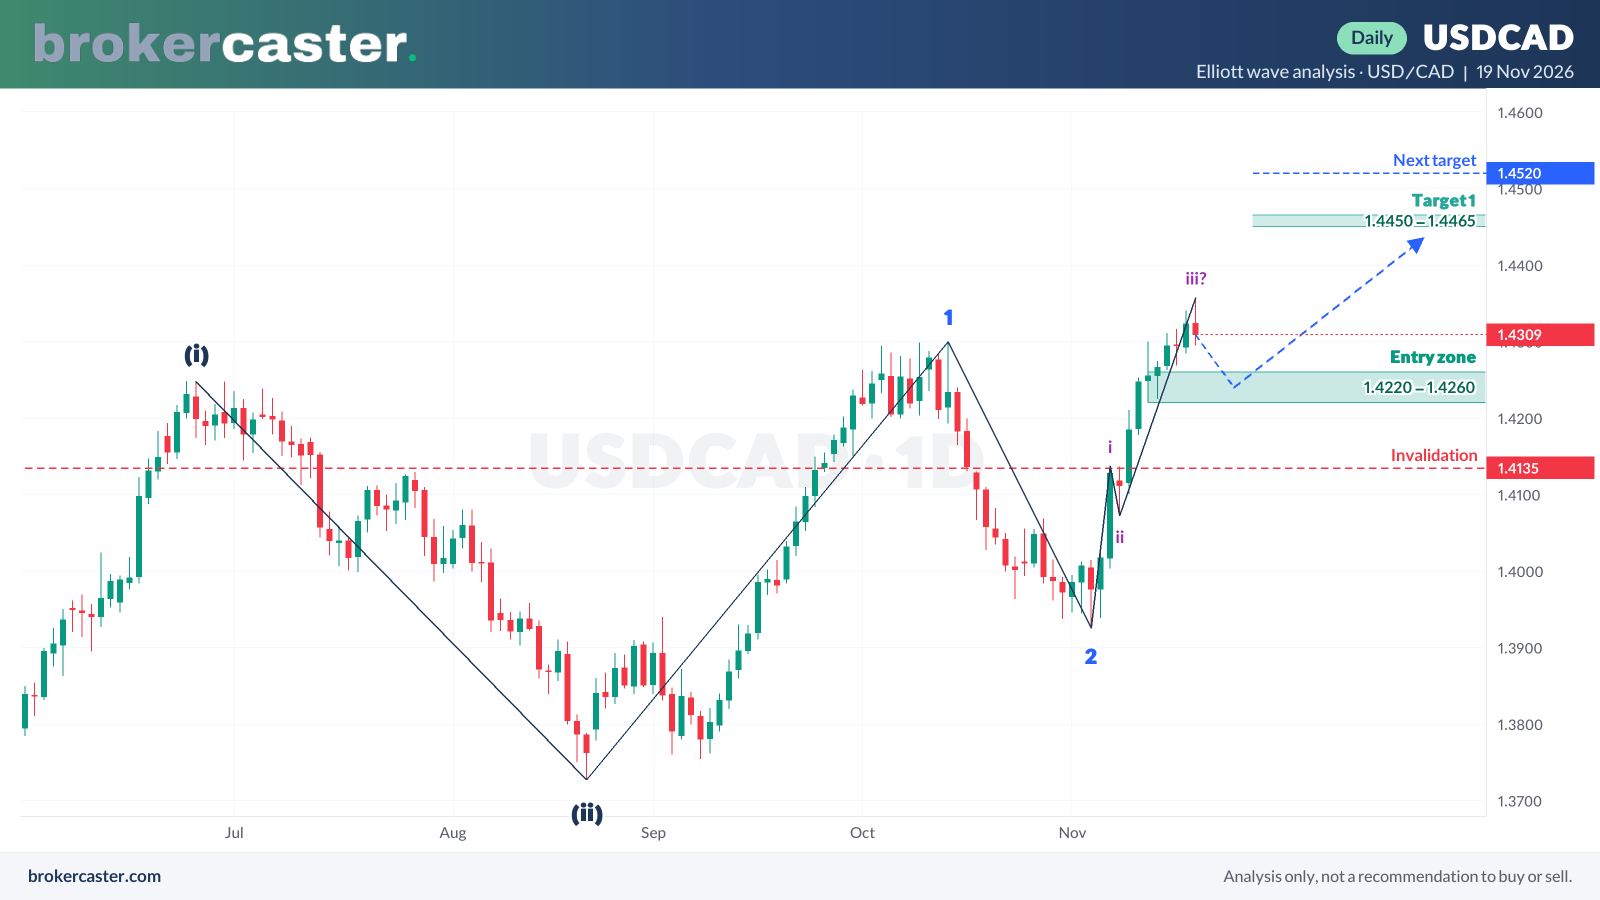
- Entry zone: 1.4260 to 1.4220 (the 12–13 November lows)
- Target 1: 1.4450 to 1.4465 (just below the 19 December 2024 and 3 January 2025 highs)
- Next target: 1.4520 to 1.4545 (the 4 and 11 March 2025 highs)
- Invalidation: a daily close below 1.4135 (the 6 November high); below 1.3926 the count is void
Alternative scenario: a daily close below 1.4135 would mean the rise from 1.3926 was probably corrective, and a deeper pullback toward 1.4073 to 1.4000 becomes likely; a further advance would then be reassessed after that pullback ends.
EUR/GBP fell to 0.8319 on 18 November. The larger structure is unchanged: the decline from the 0.8865 top (14 November 2025) is a three-part correction, and its final leg began at 0.8730 (18 May 2026); wave 1 ended at 0.8454 (15 July), wave 2 at 0.8612 (25 September), and wave 3 still appears to be under way. The main daily trend is down, and while price holds below the lower highs of the past three weeks, a further decline toward 0.8280 to 0.8262 is likely. We expect a short rebound to the top of the three-week range (0.8355 to 0.8373) before the next leg; if that rebound does not come, the scenario stays without an entry. Price has moved slowly in the past three weeks, so the target may take time.
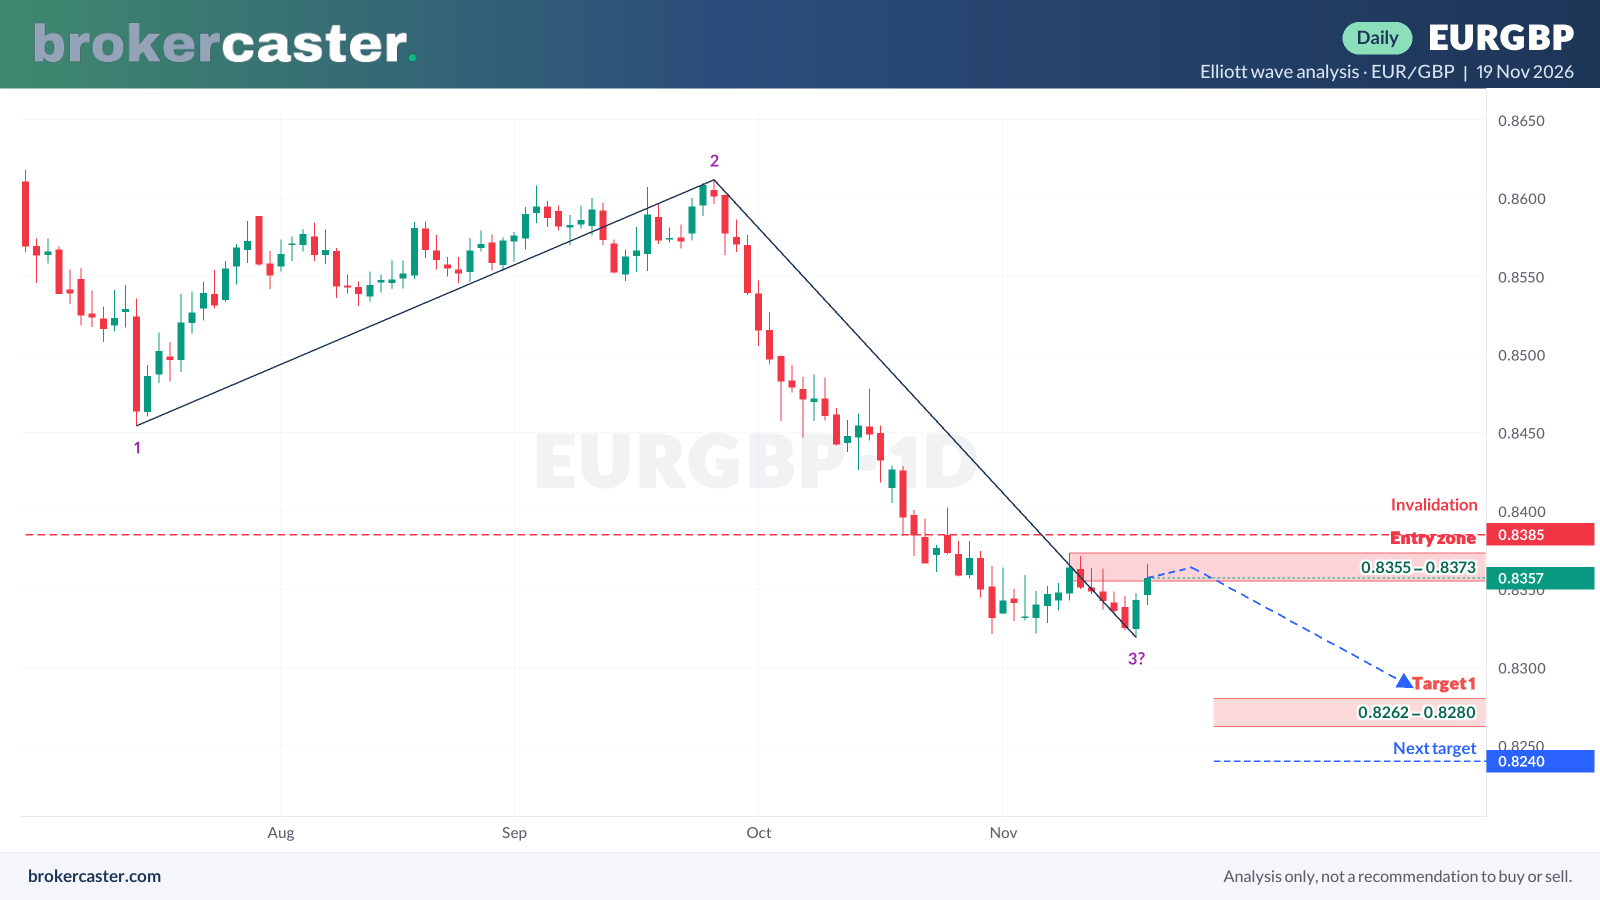
- Entry zone: 0.8355 to 0.8373 (top of the 10–13 November range)
- Target 1: 0.8280 to 0.8262 (just above the February 2025 support zone)
- Next target: 0.8240 to 0.8222 (the 19 December 2024 low)
- Invalidation: a daily close above 0.8385; above 0.8612 the count is void
Alternative scenario: a daily close above 0.8385 would suggest that wave 3 has ended and a corrective rebound (wave 4) toward 0.8415 to 0.8430 is under way; a further decline would then be reassessed only after that rebound ends.
Currency pairs we analyse
| EUR/USD | 1.0975 +0.01% · EUR/USD analysis · the most traded pair; moves on ECB and Fed policy |
|---|---|
| GBP/USD | 1.3082 −0.07% · GBP/USD analysis · Bank of England against the Fed, and UK inflation |
| USD/JPY | 158.512 −0.73% · USD/JPY analysis · follows the gap between US and Japanese interest rates |
| USD/CHF | 0.8396 −0.47% · USD/CHF analysis · the Swiss franc is a safe haven; Swiss National Bank policy |
| AUD/USD | 0.6619 −0.57% · AUD/USD analysis · tied to commodities, China and the Reserve Bank of Australia |
| USD/CAD | 1.4339 +0.01% · USD/CAD analysis · often moves with oil prices and the Bank of Canada |
| EUR/GBP | 0.8381 +0.08% · EUR/GBP analysis · euro against pound: ECB against the Bank of England |
Prices and 24-hour changes from our hourly data; each pair has its own page with a live chart.
Forex analysis for the major currency pairs
This page collects our technical analysis of the seven most traded currency pairs: EUR/USD, GBP/USD, USD/JPY, USD/CHF, AUD/USD, USD/CAD and EUR/GBP. Each pair has its own page with a live chart, price statistics and a guide to what moves it. We publish an analysis when a pair shows a clear setup, so some weeks bring several and others none.
What moves currency pairs
- Interest rates. Money tends to flow toward currencies whose central bank pays more, so rate decisions and the tone of central-bank statements are the biggest scheduled movers. See the latest decisions on central bank interest rates.
- Economic data. Inflation, jobs and growth figures change rate expectations; the economic calendar lists the next releases with forecasts.
- Risk sentiment. In stressed markets traders buy the US dollar, the Japanese yen and the Swiss franc, and sell currencies linked to growth such as the Australian dollar.
- Trading sessions. Forex trades 24 hours a day from Monday to Friday. Volume is highest in the four hours when London and New York are both open (from about 12:00 or 13:00 UTC, depending on daylight saving) and thinnest around the daily rollover.
Forex technical analysis: how to read our scenarios
Each analysis is a scenario on a stated timeframe: the zone where the idea becomes active, one or two targets, and the level that cancels it. After the event we label it with the result, so past calls stay on the site and can be checked. An analysis is not an instruction to trade; it describes one way the market could move.
Trading currency pairs with a broker
The cost of a forex trade is the spread plus any commission, and the swap if you hold overnight. Retail leverage on major pairs is capped at 1:30 in the UK, the EU and Australia; offshore brokers offer much more, which multiplies losses too. Before you trade, size the position with the lot size calculator, check the pip value and compare costs in our forex broker reviews.